UCSF Chimera is a free molecular modeling program (available for Unix, MacOS X, and Windows) with a lot of tools and integrated resources for biological systems. Chimera has already been installed on the lab computers, but you can install it on your personal computer as well.
Unlike VMD, Chimera does not require flags to load structures from the command line. That said, of all the file formats AMBER uses (i.e. PDB, mdcrd, prmtop, inpcrd, rst, etc.) Chimera can only open a PDB file, so it is crucial to use VMD to save a PDB of the last frame of a simulation for the purpose of generating images.
There are two likely types of difference graphs that you’ll want to make images
for based on residue, and those are
matrix correlations and
EDA plots by residue.
The first step for both of these is to create a .txt file with certain
information for defining an attribute in Chimera.
To do this, the first 3-5 lines of the data file set up the type of plotting
that will be created, following an identifier: value fashion.
- It is good housekeeping to start this file with a comment describing what
the data are. This might just be the system names that the difference was drawn
from.
- Ex:
#KINASE-WT--MUT-A
- Ex:
- This line is the attribute name that Chimera will use to reference the data.
It cannot begin with a number, underscore, or capital letter.
That said, it can contain underscores and alphanumeric characters, as long as
no spaces are used.
- Ex:
attribute: coul-EDA-WT--MUT-A
- Ex:
- This line specifies the match mode.
By default, it is set to
any, but other options includenon-zeroand1-to-1.- Ex:
match mode: 1-to-1
- Ex:
- This line specifies the recipient of the matching as
atoms(default),residues, ormolecules. - Finally, if your data has values set as
none, then you can choose whether to treat those as they Python value None, as a string, or delete them. You shouldn’t need this, but if you ever find yourself in that situation, just know it exists.- Ex:
recipient: residues
- Ex:
The remaining lines are formatted as [Tab] :atomnumber [Tab] attribute-value.
So your data would appear left-aligned like:
	:1   1.325
	:2   -0.313
	:3   -2.109
A sample bash script for making these files is
chimeraprint.sh.
There’s more specific information about generating these attribute lists based on matrix correlation data and EDA data.
To actually create the graphs, open the PDB saved from the final frame in
Chimera. Then, follow
Tools → Structure Analysis → Define Attribute
in Chimera’s main menu. This will open a list of files and folders.
Select the data file (that has the attribute information just described) for
what you’re trying to plot, keeping Open/Render/Select by Attribute checked.
If you’re making several images at a time, you may also want to check the
Keep dialog up after Open box.
Once the attribute has been loaded in, a box with setting information appears (Fig. \ref{fig:redbluegraphs}).
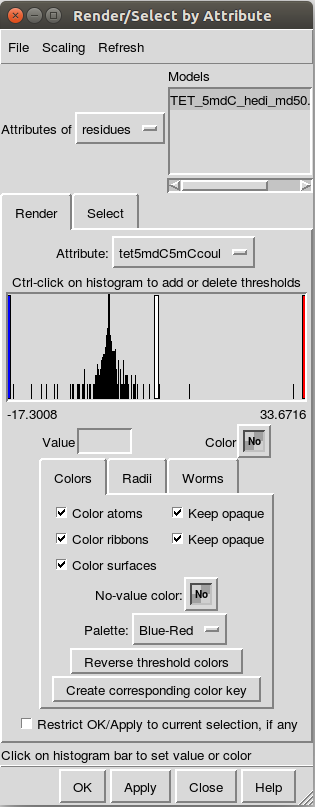
The steps for making images include:
- Clicking on
Reverse Threshold Colors, which will make any negative values red and positive values blue. - Selecting the red bar (click in the histogram area) and manually setting the
value to
-0.5for matrix correlations-1or-2for EDA.
by putting it in the
Valuebox and hitting the enter key. - Selecting the blue bar (click in the histogram area) and manually setting the
value to
0.5for matrix correlations1or2for EDA, being consistent with the red bar.
by putting it in the
Valuebox and hitting the enter key. - Selecting the white bar (click in the histogram area) and manually set the
color to a nice yellow color, with some sort of opacity.
For me, that color is near
#ffffffff9792(Chimera may change it on you, it’s okay, just keep it consistent) with an A value (which is the opacity) of0.591. - Hit
Apply - Select any residues that you wanted to display by using Chimera’s command
line
Favorites → Command Lineand typing something likeselect :200where
200would be the residue number. Then, followActions → Atoms/Bonds → Showto show the residue. To deselect the residue (i.e. make it not have a green outline), either dodeselect :200in Chimera’s command line or hit the CTRL key and click in an area of white space. - Orient the protein in the manner that you would like it to be photographed.
- Go to
File → Save Imagein the menu bar. The settings for this should be a PNG format with4x4 supersampleandtransparent background. Like in VMD, if you have multiple structures loaded in, specifically highlight the one you’re interested in. - Once saved, do a happy dance! You created yet another image! Incredible!
If you need to create a key for the coloration that you just did, see the section on Color Keys.