The NMD file can be prepared for use with ProDy using cpptraj. How cool is that?
First, you need to create a covariance matrix using the matrix command.
Covariance is a fancy way to say that you’re looking for the overall change in
A with respect to B, B with respect to C, and so on.
In this case, we’re trying to reduce down multi-dimensional coordinate data
and then compare each of the residues to each other.
After creating the matrix, use the diagmatrix command to calculate the
eigenvectors of the matrix and generate the NMWiz files.
## For normal modes (evecs = eigenvectors)
matrix out WT_protein_system_covar_mat.dat name norm_mode :1-476@CA,P,C4',C2 covar
diagmatrix norm_mode out WT_protein_system_evecs.out vecs 100 reduce \
 nmwiz nmwizvecs 100 nmwizfile WT_protein_system_100.nmd nmwizmask :1-476@CA,P,C4',C2
The mask used above (@CA,P,C4',C2) is based on what the ProDy interface in
VMD uses (protein and name CA or nucleic and name P C4' C2) by default.
Python can be used to make the mobility plots that became the normal mode plots that we got to know and love with gnuplot. Future Mark will share a script for that on his GitHub. Until then, I have included my forked version here.
NMA_plot_mult.py
import numpy as np
import prody as prd
import matplotlib.pyplot as plt

## Typically 3 modes will be enough
num_of_modes = 4

## Create a list of tuple (infile_name, outfile_name, system_name)
## These are the NMD file, the PNG file, and the tag for the system to determine
## the top X ticks through plot_ticks
in_out_sys_names = [
  ("WT_protein_system_r1_100.nmd", "WT_protein_system_r1_NMA.png", "WT"),
  ("WT_protein_system_r2_100.nmd", "WT_protein_system_r2_NMA.png", "WT"),
  ("WT_protein_system_r3_100.nmd", "WT_protein_system_r3_NMA.png", "WT"),
  ("MUT_A_system_r1_100.nmd", "MUT_A_system_r1_NMA.png", "MUTA"),
  ("MUT_A_system_r2_100.nmd", "MUT_A_system_r2_NMA.png", "MUTA"),
  ("MUT_A_system_r3_100.nmd", "MUT_A_system_r3_NMA.png", "MUTA"),
  ("MUT_B_system_r1_100.nmd", "MUT_B_system_r1_NMA.png", "MUTB"),
  ("MUT_B_system_r2_100.nmd", "MUT_B_system_r2_NMA.png", "MUTB"),
  ("MUT_B_system_r3_100.nmd", "MUT_B_system_r3_NMA.png", "MUTB"),
]

def plot_ticks(sys, NMA_data):
    """Sets top xticks. You NEED the 0 and NMA_data.numAtoms(), otherwise the
    scale will be turned off.
    **This is an example, you'll need to modify it for your system.**
    """
    if sys == "MUTA":
        labels_top = ["", "MUTA", "GS linker", "", "DNA", ""]
        places_top = [0, 141, 334, 346, 431, NMA_data.numAtoms()]
    elif sys == "MUTB":
        labels_top = ["", "GS linker", "", "MUTB", "DNA", ""]
        places_top = [0, 334, 346, 378, 431, NMA_data.numAtoms()]
    elif sys == "WT":
        labels_top = ["","GS linker", "", "DNA", ""]
        places_top = [0, 334, 346, 431, NMA_data.numAtoms()]
    else:
        labels_top = []
        places_top = []
    return labels_top, places_top


def NMA_plots(filename,outfile,sys):
        """Creates a plot of the most important modes for a system.
        Parameters
        ----------
        filename : str
            An NMD file.
        outfile: str
            Name of the output PNG.
        sys: str
            A name (e.g., WT, MUT A, MUT B, etc.) for the system. Replicates
            should have the same name.
        """
        NMA_data,Atom_Group = prd.parseNMD(filename)
        eigens = NMA_data.getEigvals()

        labels_top, places_top = plot_ticks(sys, NMA_data)

        scales=[]
        temp = open(filename)
        lines = temp.readlines()
        temp.close()
        for line in lines:
            if 'mode' in line[:5]:
                scales.append(float(line.split()[:3][-1]))

        ## Make an array of the number of atoms for plotting
        x_vals = np.arange(0, NMA_data.numAtoms(), 1)

        fig = plt.figure(figsize=(10,8),dpi=300)
        ax = fig.add_subplot(1,1,1)
        for i in range(num_of_modes):
            dataset = [np.linalg.norm(NMA_data.getEigvecs()[:,i][n:n+3])*scales[i]*eigens[i] for n in range(0, NMA_data.numEntries(), 3)]
            ax.bar(x_vals, dataset, width=1.0, label="Mode "+str(i+1))

        ax_top = ax.twiny()
        ax_top.set_xticks(places_top)
        ax_top.set_xticklabels(labels_top, fontdict=None, minor=False)

        ax.legend()
        ax.set_xlabel("Residue Number")
        ax.set_ylabel("PCA Square Fluctuations")
        ax.set_xlim([0,x_vals.size]) ## Remove white space at edge
        plt.tight_layout()
        fig.savefig(outfile,dpi=300)
        plt.close()

for filename,outfile,sys in in_out_sys_names:
    NMA_plots(filename,outfile,sys)
Reading the .nmd File with Structure in VMD
Reading the .nmd file can be done on its own with the NMWiz plugin, but
that file doesn’t contain structure information that you probably want for
image making.
This can be addressed through the following steps:
- Load in either a PDB file or both a
.prmtopand.rstfile into VMD. - Follow
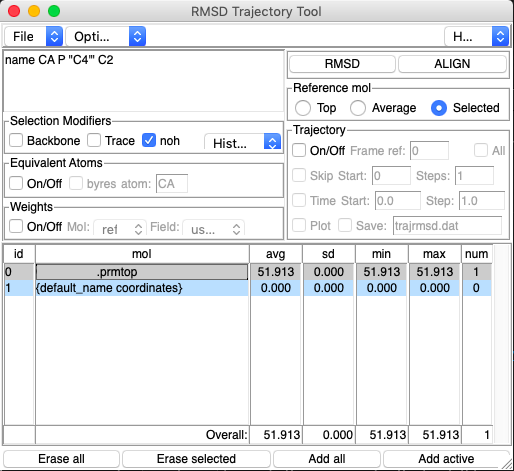
Extensions → Analysis → Normal Mode Wizard →
Load NMD File
to load the NMD file. - Open the RMSD Trajectory Tool through
Extensions → Analysis →
RMSD Trajectory Tool
. - In the Tool, match the name you used in
cpptrajto create the command in the top left box (likelyname CA P "C4'" C2orname CA). - In the
Trajectorybox on the right, deselect all options. - Remove the
{ default_name arrow}option by highlighting and choosingErase selected. - Choose the
Selectedbubble underReference mol. - Highlight
{ default_name coordinates}and clickRMSD. - Once the RMSD has finished, click
ALIGN.
You specifically want to highlight { default_name coordinates} so that the
arrows and “coordinates” stay in the same place and only the full structural
coordinates move.
Otherwise, the tube tracing and structure will be in one place and the arrows
will be in another.
This transformation will not be saved in a .vmd visualization state file.
Using the Trajectory Tool