To open a checkpoint file, follow:
FileOpen- Select the
.chkfile
Gaussian Logfile
The logfile (.log) contains all of the job information. You should always
check the logfile for successful job completion! The “it did something” way is
to check the end for an end quote. The “real” way is to check for convergence.
That said, not everything that has a Gaussian logfile will have convergence
information, but it will have information indicating that what you were doing
worked.
IF OTHER PEOPLE ARE GOING TO TALK, CONVERSATION IS SIMPLY
IMPOSSIBLE.
-- WHISTLER'S
PRINCIPLE
Job cpu time: 0 days 0 hours 0 minutes 3.0 seconds.
Elapsed time: 0 days 0 hours 0 minutes 2.8 seconds.
File lengths (MBytes): RWF= 6 Int= 0 D2E= 0 Chk= 1 Scr= 1
Normal termination of Gaussian 16 at Fri Jun 7 10:02:03 2019.
Summary
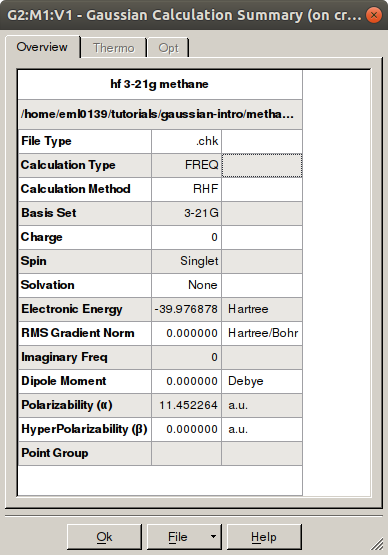
The summary window contains job information and some results. To access the
results summary, follow: Results → Summary. One
Eh (hartree) is equivalent to 627.509474 kcal mol-1.
There’s a great energy converter page from
Colby College that you can
use to make this more meaningful to you.
Vibrations
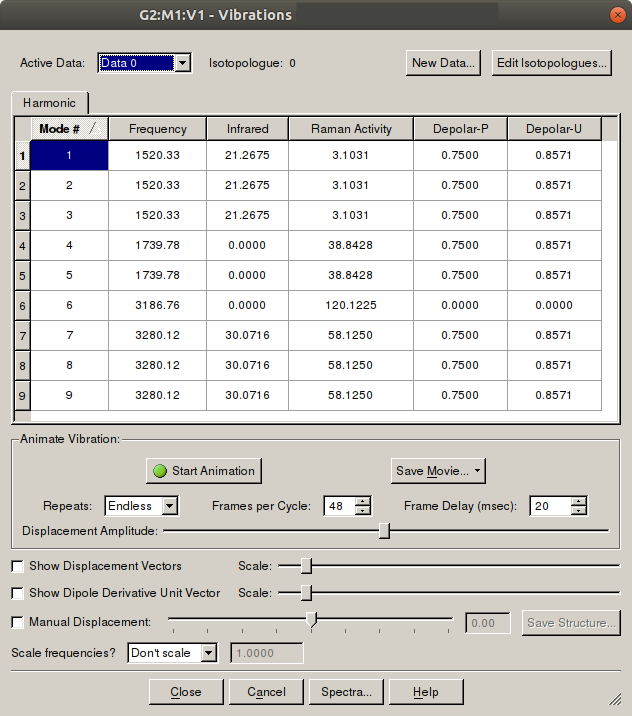
The vibrations window contains frequency and Raman information. From this
window, you can watch animations of stretching and vibrations. To access the
window, follow: Results → Vibrations.
Charge Distribution
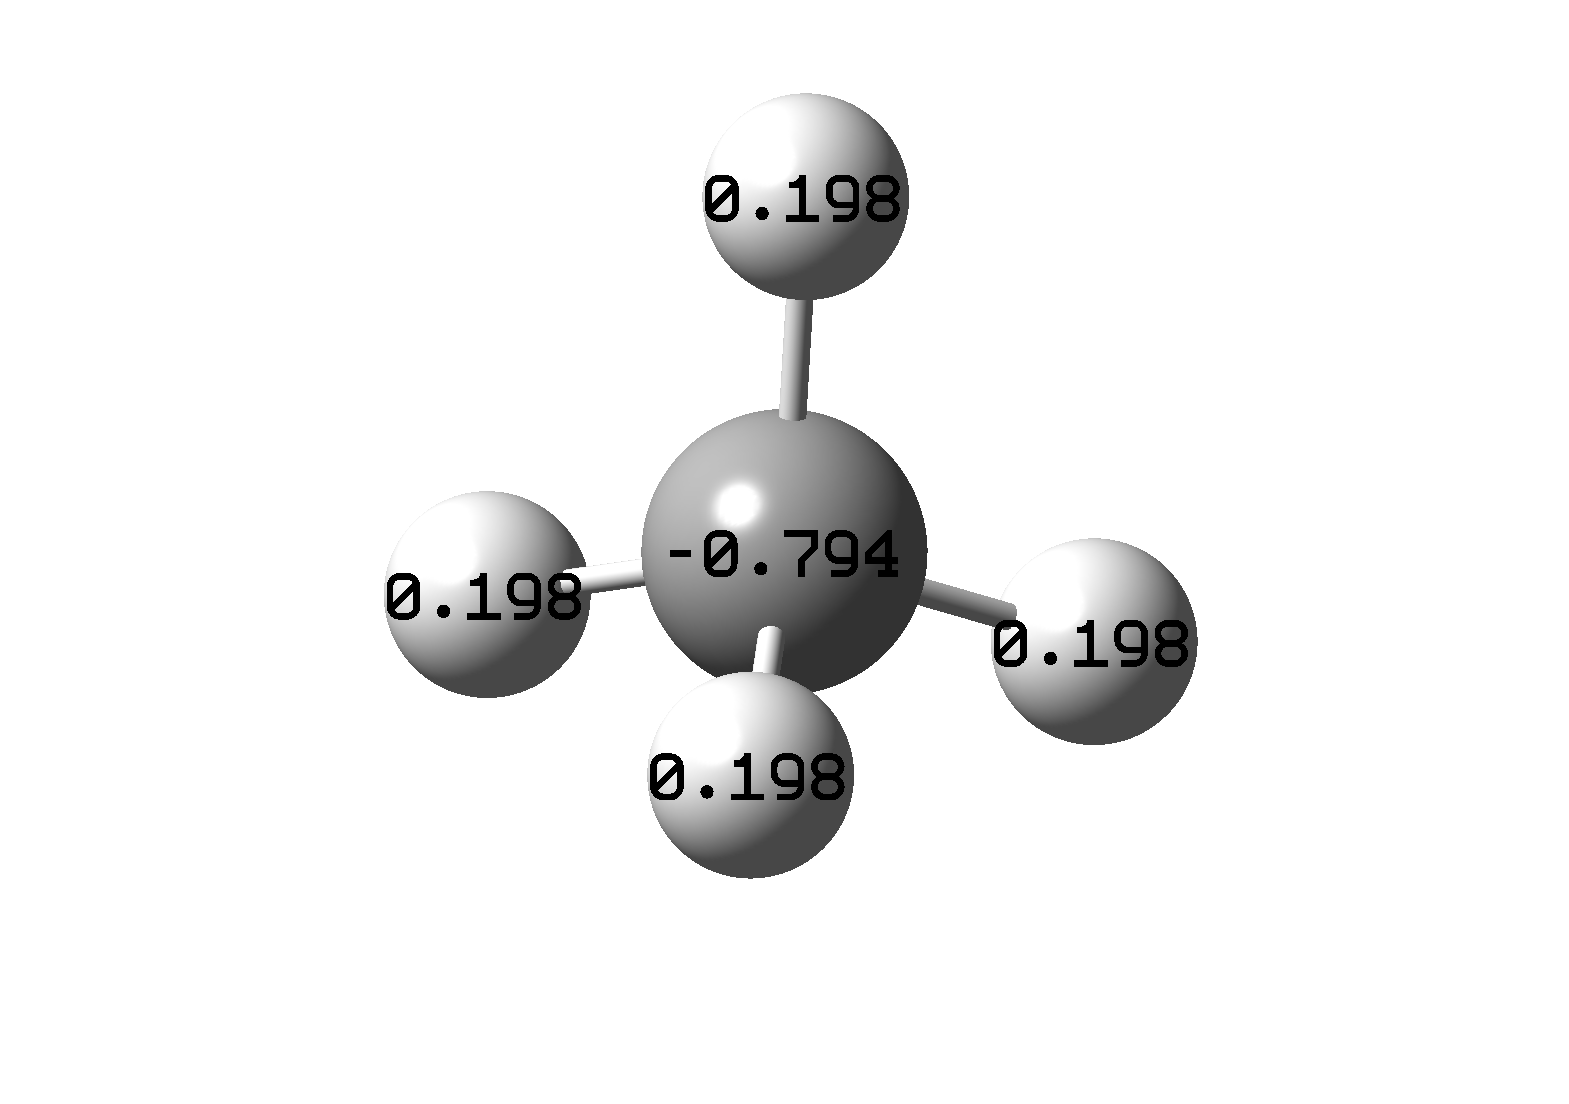
The charge distribution can be plotted on the structure. To access the
distribution, follow: Results → Charge Distribution.
Cube Data
Different data can be plotted onto the structure. This can be accomplished
by following Results → Surfaces/Contours, which brings up the
surfaces and contours window.
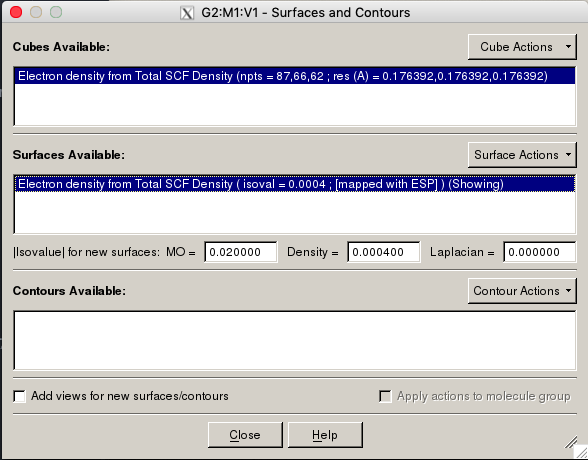
First, pick a type of information to show on the structure through
Cube Actions → New Cube. You can plot several different
properties. For the example below, I picked the total density as the content
for the new cube. The grid options specify how smooth the surface looks.
Coarse is fine for quick images, and Medium should be alright for
presentations or posters.
You can also use those cubes to plot different information.
To do so, follow Surfaces Available → New Mapped Surfaces
in the second block. I picked electrostatic potential (ESP) for the example.
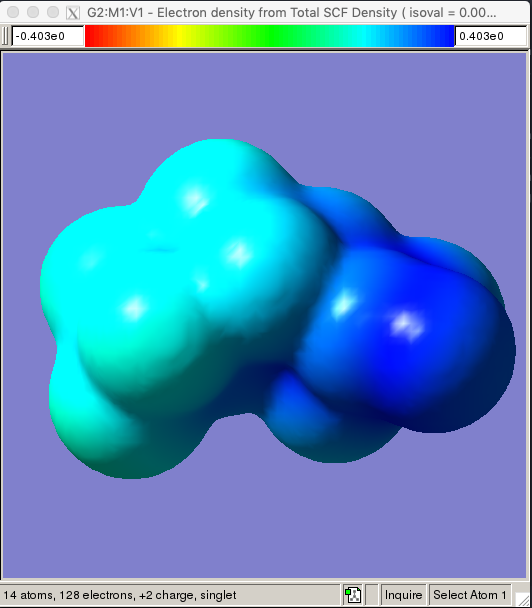
Cubes can be saved, but surfaces will be recalculated each time.