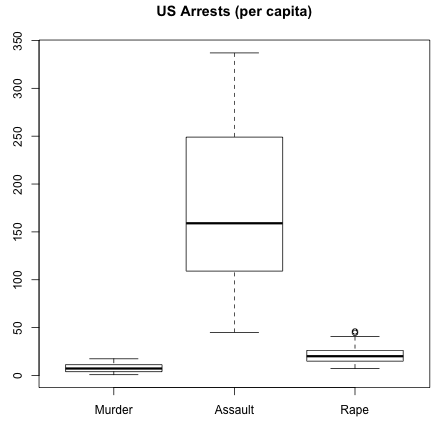
Boxplots are one way of graphically orienting information from the
summary(variable) command.
> setwd("~/Desktop")
> png("arrests_boxplot.png")
> boxplot(USArrests$Murder,USArrests$Assault,USArrests$Rape, names=c("Murder","Assault","Rape"),main="US Arrests (per capita)")
> dev.off()
null device
          1

Because specific columns of data were selected, their individual names had to be specified to create the image above. Otherwise, the default names of 1, 2, and 3, would have been used.