The following example shows what steps were taken to create a vector named
population and then have a barplot with those values.
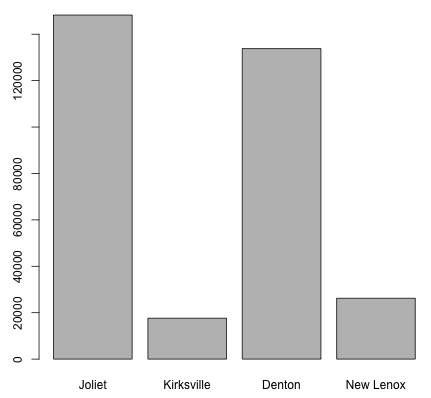
> population <- c(148262,17619,133808,26217)
> names(population) <- c("Joliet", "Kirksville", "Denton", "New Lenox")
> setwd("~/Desktop")
> png(filename="populationbarplot.png")
> barplot(population)
> dev.off()
null device
	1
The command names assigned names to the values in the vector population.
The working directory was set to specify where the file save location for a
png file of the generated image populationbarplot.png should be saved
(in this case, the Desktop). (Note: you can also select pdf() and jpg().)
Then, the barplot was made with barplot.
Finally, because you’re no longer using the screen for image generation,
you turn off the graphics device with dev.off().
The generated barplot is shown in the image below.
barplot, which creates a barplot.To add a line at the mean (or median, etc.) of the population, the abline
command can be used, which will update the current plot.
> abline(h = mean(population))
To show one standard deviation above the mean, use an argument of
h = mean(population) + sd(population).
The only way to remove a line by mistake is to regenerate the barplot and
effectively start over.
Multiple lines need to be added with individual abline commands.